
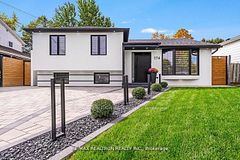
For Sale
$1,689,999Georgetown, Halton Hills4 bd 4 ba
$1,689,999 asking. 4 bed, 4 bath, 1,300 square feet, Detached. 174 Mountainview Road S, Halton Hills, ON. For Sale. 0 days on site.Listed by RE/MAX REALTRON REALTY INC..
Search every listing, then read the cash it takes to close one, line by line, with the statute or the price range behind each figure. Where we do not have a number, the row stays empty rather than filled in.
No suggestions
46 sold homes in this area are hidden. Sold prices and listing history come from the real estate board feed, shown to members only.
Sign in to see soldListed by RE/MAX REALTRON REALTY INC..
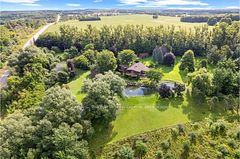
Listed by Engel & Volkers Toronto Central.

Listed by REVEL Realty Inc., Brokerage.

Listed by RE/MAX ABOUTOWNE REALTY CORP..

Listed by RE/MAX Hallmark York Group Realty Ltd..

Listed by ROYAL LEPAGE RCR REALTY.
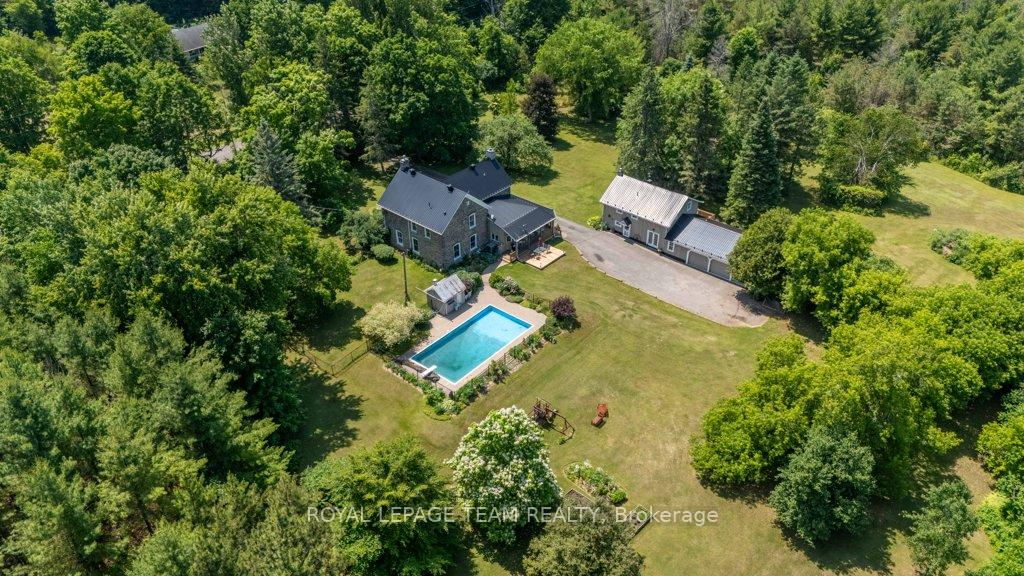
Listed by ROYAL LEPAGE TEAM REALTY.
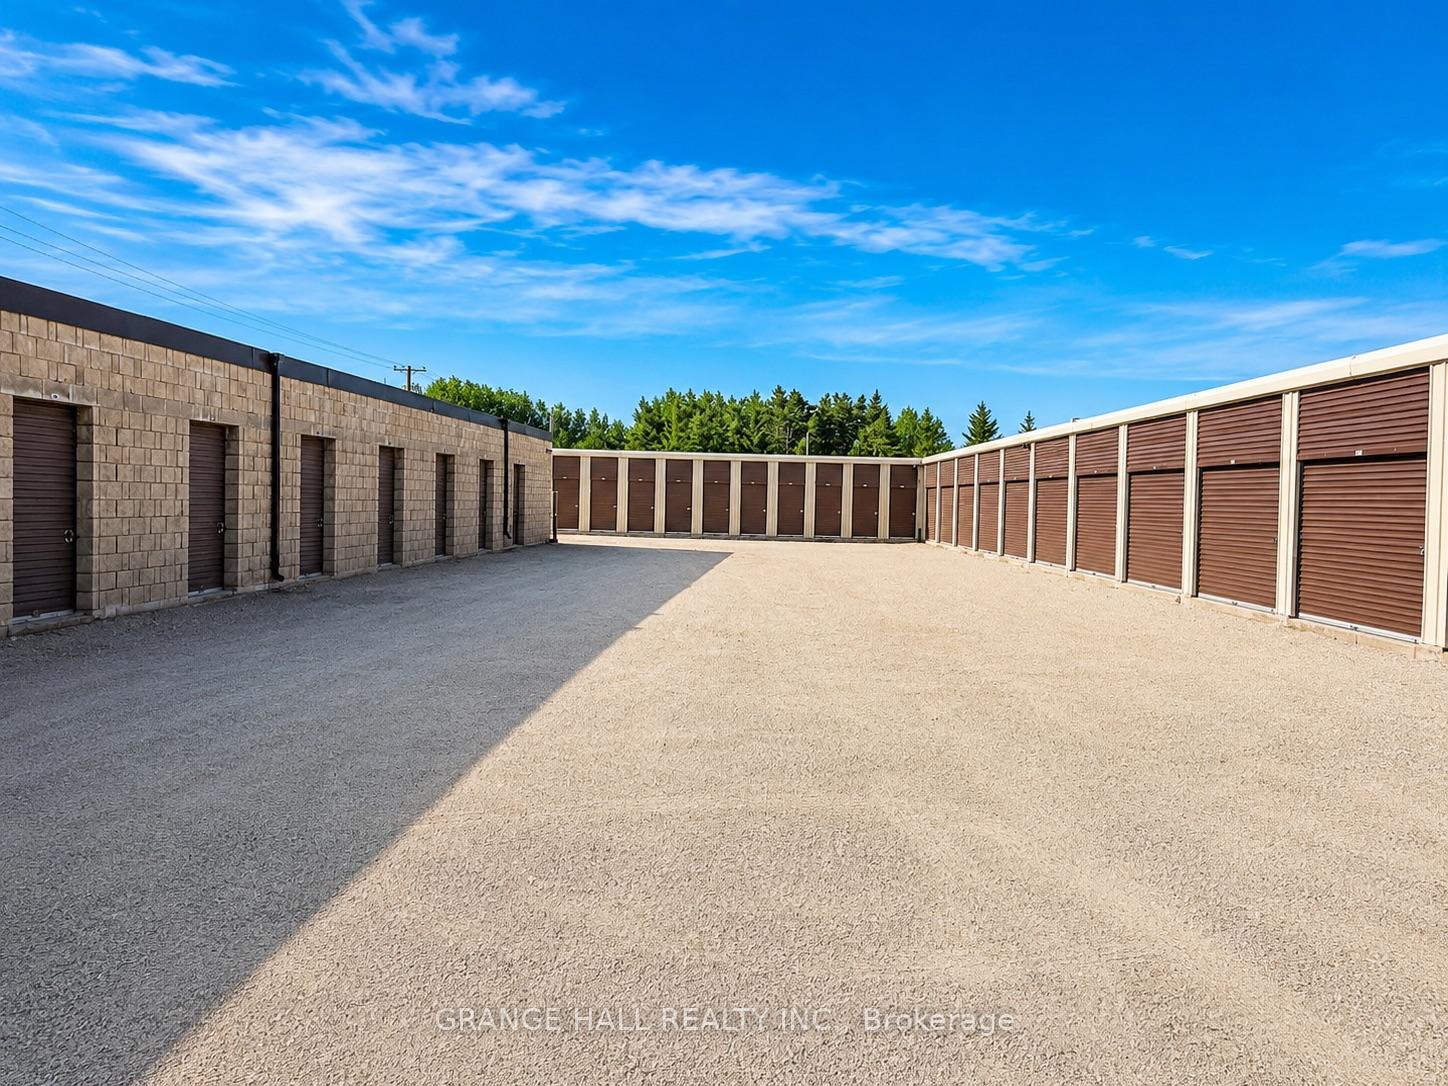
Listed by GRANGE HALL REALTY INC..

Listed by RESIDENTIAL DEVELOPMENT SERVICES INC..
Listed by FAMILY REALTY NIAGARA INC, BROKERAGE.
Listed by ROYAL LEPAGE BURLOAK REAL ESTATE SERVICES.
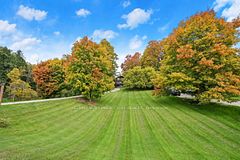
Listed by RE/MAX HALLMARK CHAY REALTY.

Listed by RE/MAX FINEST REALTY INC., BROKERAGE.

Listed by SIGNATURE TEAM REALTY LTD..

Listed by HOMELIFE/MIRACLE REALTY LTD.

Listed by RE/MAX MILLENNIUM REAL ESTATE.

Listed by Century 21 Blue Sky Region Realty Inc., Brokerage.
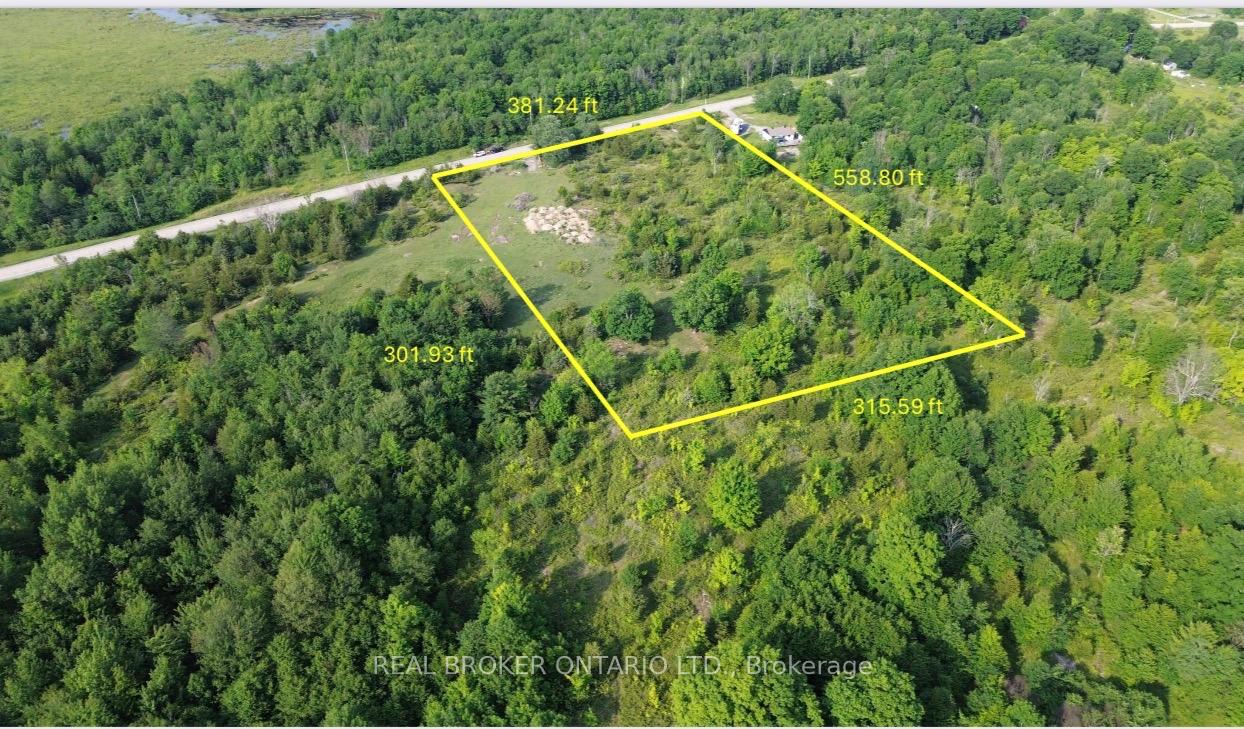
Listed by REAL BROKER ONTARIO LTD..
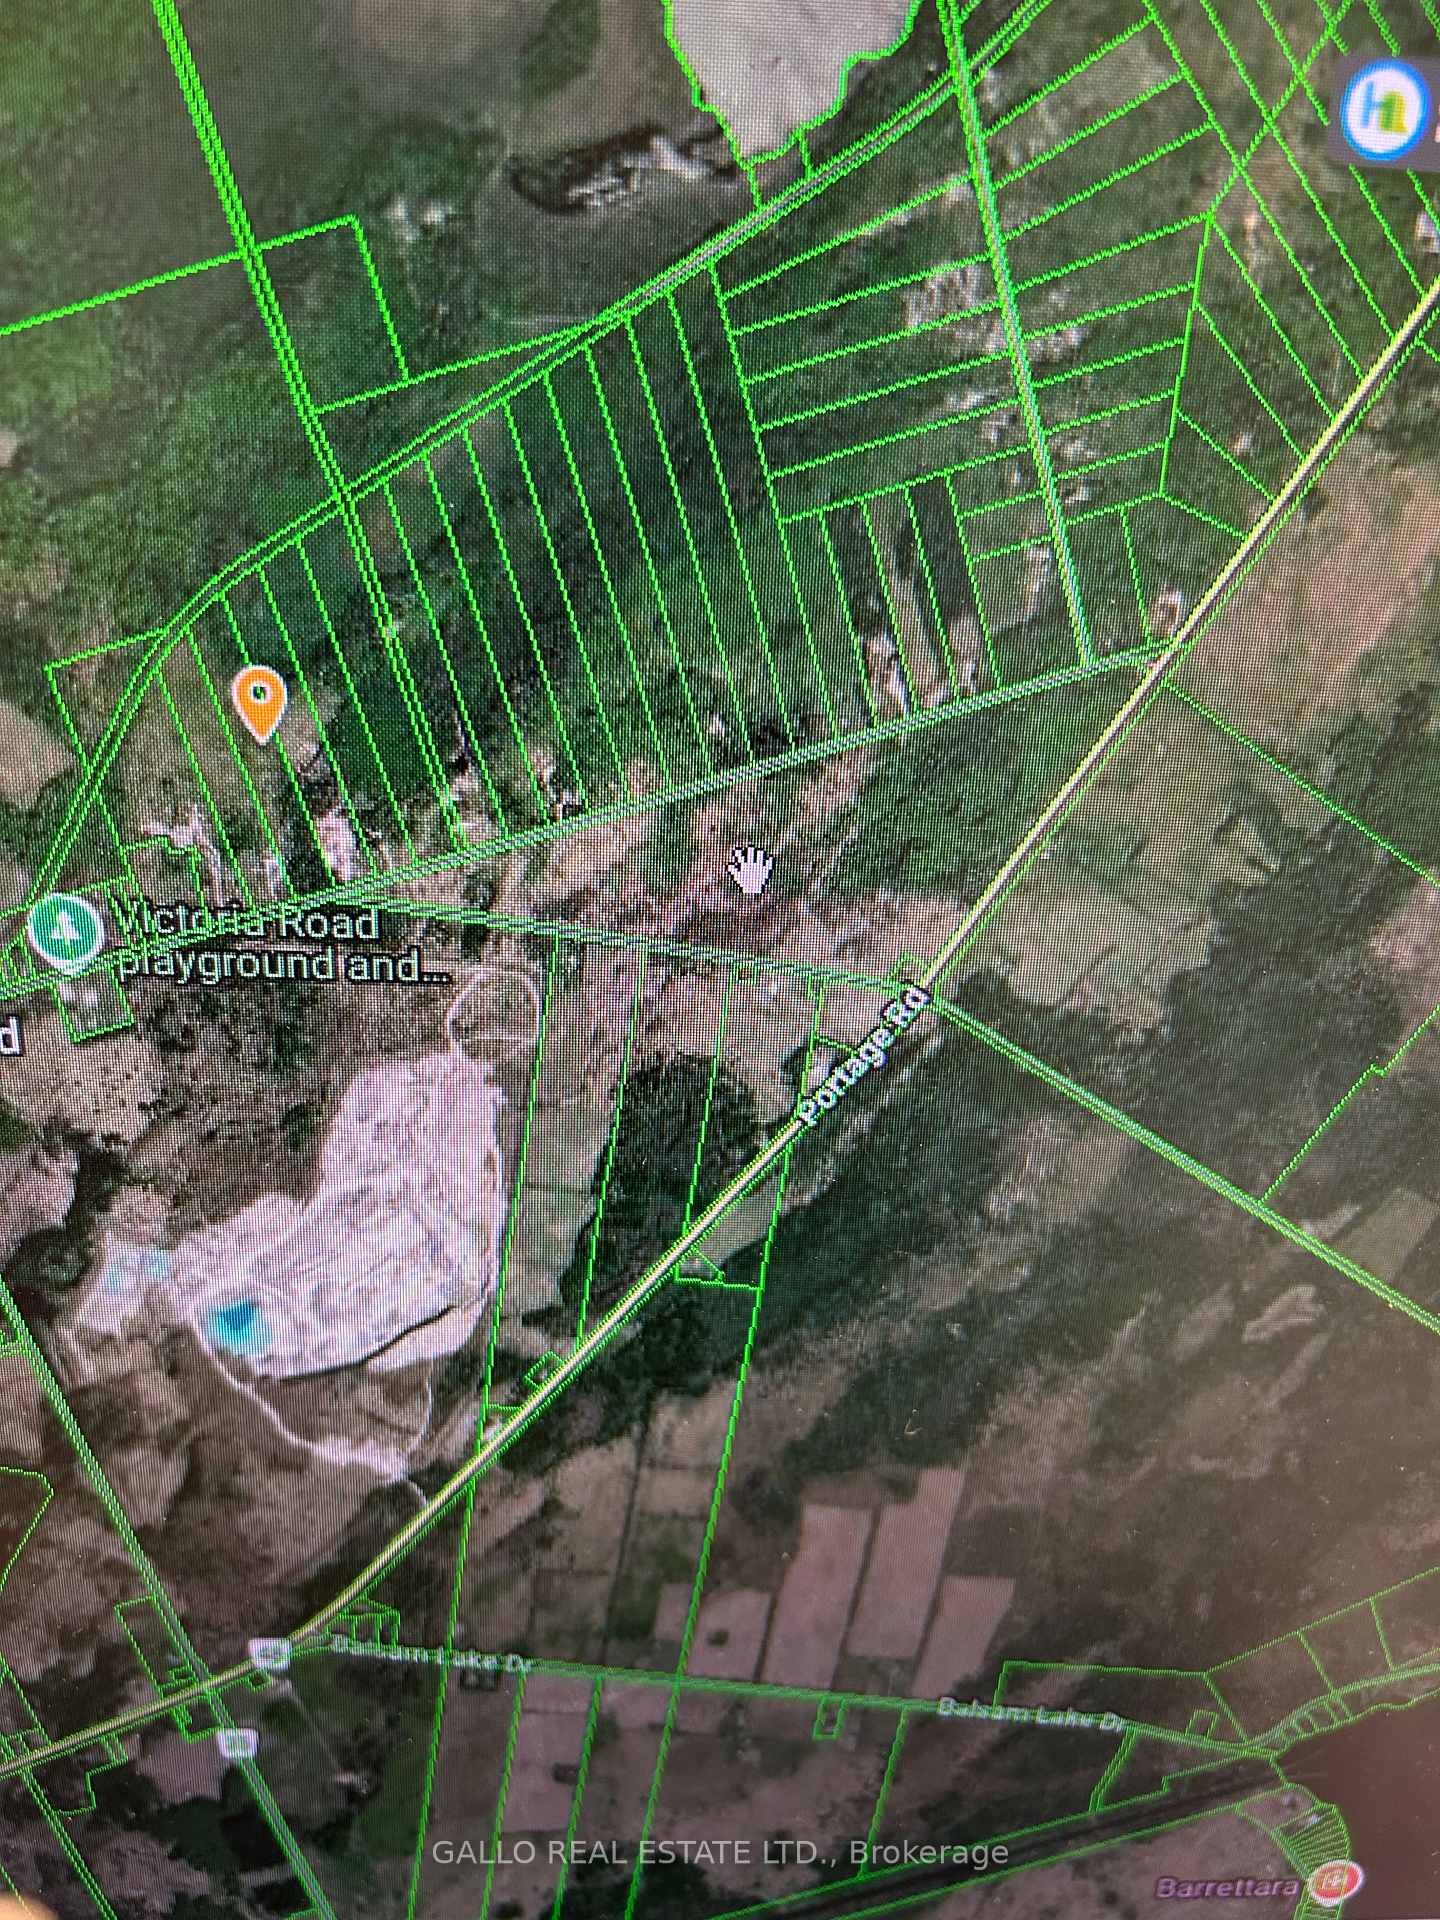
Listed by GALLO REAL ESTATE LTD..

Listed by RE/MAX SKYWAY REALTY INC..
Listed by RE/MAX REALTRON REALTY INC..
192.3% above the median per square foot of the 20 priced homes in this set
Listed by Engel & Volkers Toronto Central.
15.9% below the median per square foot of the 20 priced homes in this set
Listed by REVEL Realty Inc., Brokerage.
137.7% above the median per square foot of the 20 priced homes in this set
Listed by RE/MAX ABOUTOWNE REALTY CORP..
68.6% below the median per square foot of the 20 priced homes in this set
Listed by RE/MAX Hallmark York Group Realty Ltd..
105.5% above the median per square foot of the 20 priced homes in this set
Listed by ROYAL LEPAGE RCR REALTY.
Listed by ROYAL LEPAGE TEAM REALTY.
8.8% below the median per square foot of the 20 priced homes in this set
Listed by GRANGE HALL REALTY INC..
32.6% below the median per square foot of the 20 priced homes in this set
Listed by RESIDENTIAL DEVELOPMENT SERVICES INC..
284.8% above the median per square foot of the 20 priced homes in this set
Listed by FAMILY REALTY NIAGARA INC, BROKERAGE.
0.0% below the median per square foot of the 20 priced homes in this set
Listed by ROYAL LEPAGE BURLOAK REAL ESTATE SERVICES.
142.0% above the median per square foot of the 20 priced homes in this set
Listed by RE/MAX HALLMARK CHAY REALTY.
22.1% above the median per square foot of the 20 priced homes in this set
Listed by RE/MAX FINEST REALTY INC., BROKERAGE.
56.9% below the median per square foot of the 20 priced homes in this set
Listed by SIGNATURE TEAM REALTY LTD..
50.3% below the median per square foot of the 20 priced homes in this set
Listed by HOMELIFE/MIRACLE REALTY LTD.
19.2% above the median per square foot of the 20 priced homes in this set
Listed by RE/MAX MILLENNIUM REAL ESTATE.
1.8% above the median per square foot of the 20 priced homes in this set
Listed by Century 21 Blue Sky Region Realty Inc., Brokerage.
64.0% below the median per square foot of the 20 priced homes in this set
Listed by REAL BROKER ONTARIO LTD..
Listed by GALLO REAL ESTATE LTD..
Listed by RE/MAX SKYWAY REALTY INC..
70.2% below the median per square foot of the 20 priced homes in this set