
No photo
For Rent
No priceMount Pleasant East, Toronto C102 bd 1 ba
No price on record. 2 bed, 1 bath, 900 square feet, Detached. 2 - 229 Manor Road E, Toronto C10, ON. For Rent. 0 days on site.Listed by BOSLEY REAL ESTATE LTD..
12,958 homes homes match near this map view, of which 20 are on this page.
12,364 sold homes in this area are hidden. Sold prices and listing history come from the real estate board feed, shown to members only.
Sign in to see soldListed by BOSLEY REAL ESTATE LTD..
Listed by BOSLEY REAL ESTATE LTD..
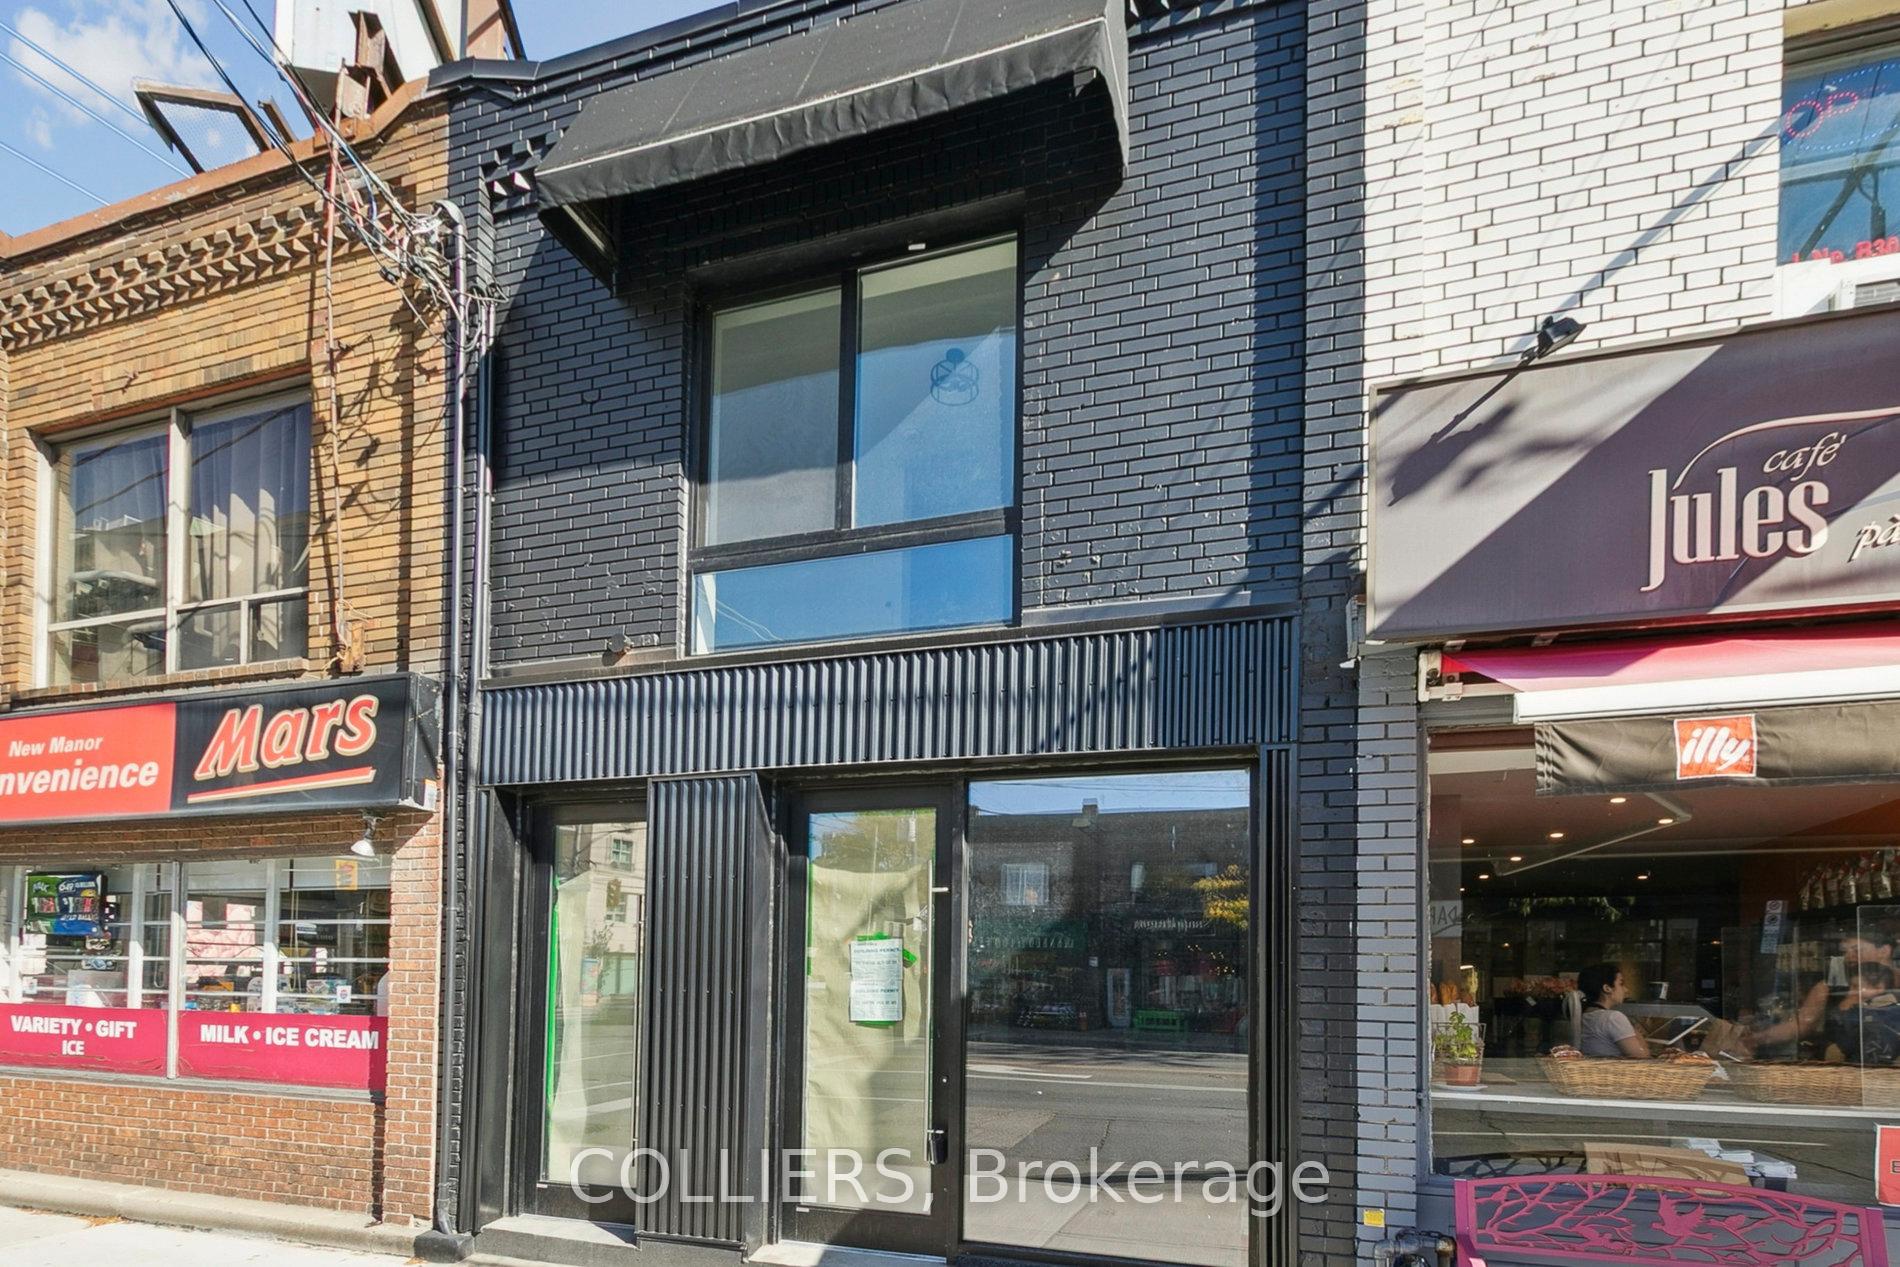
Listed by COLLIERS.
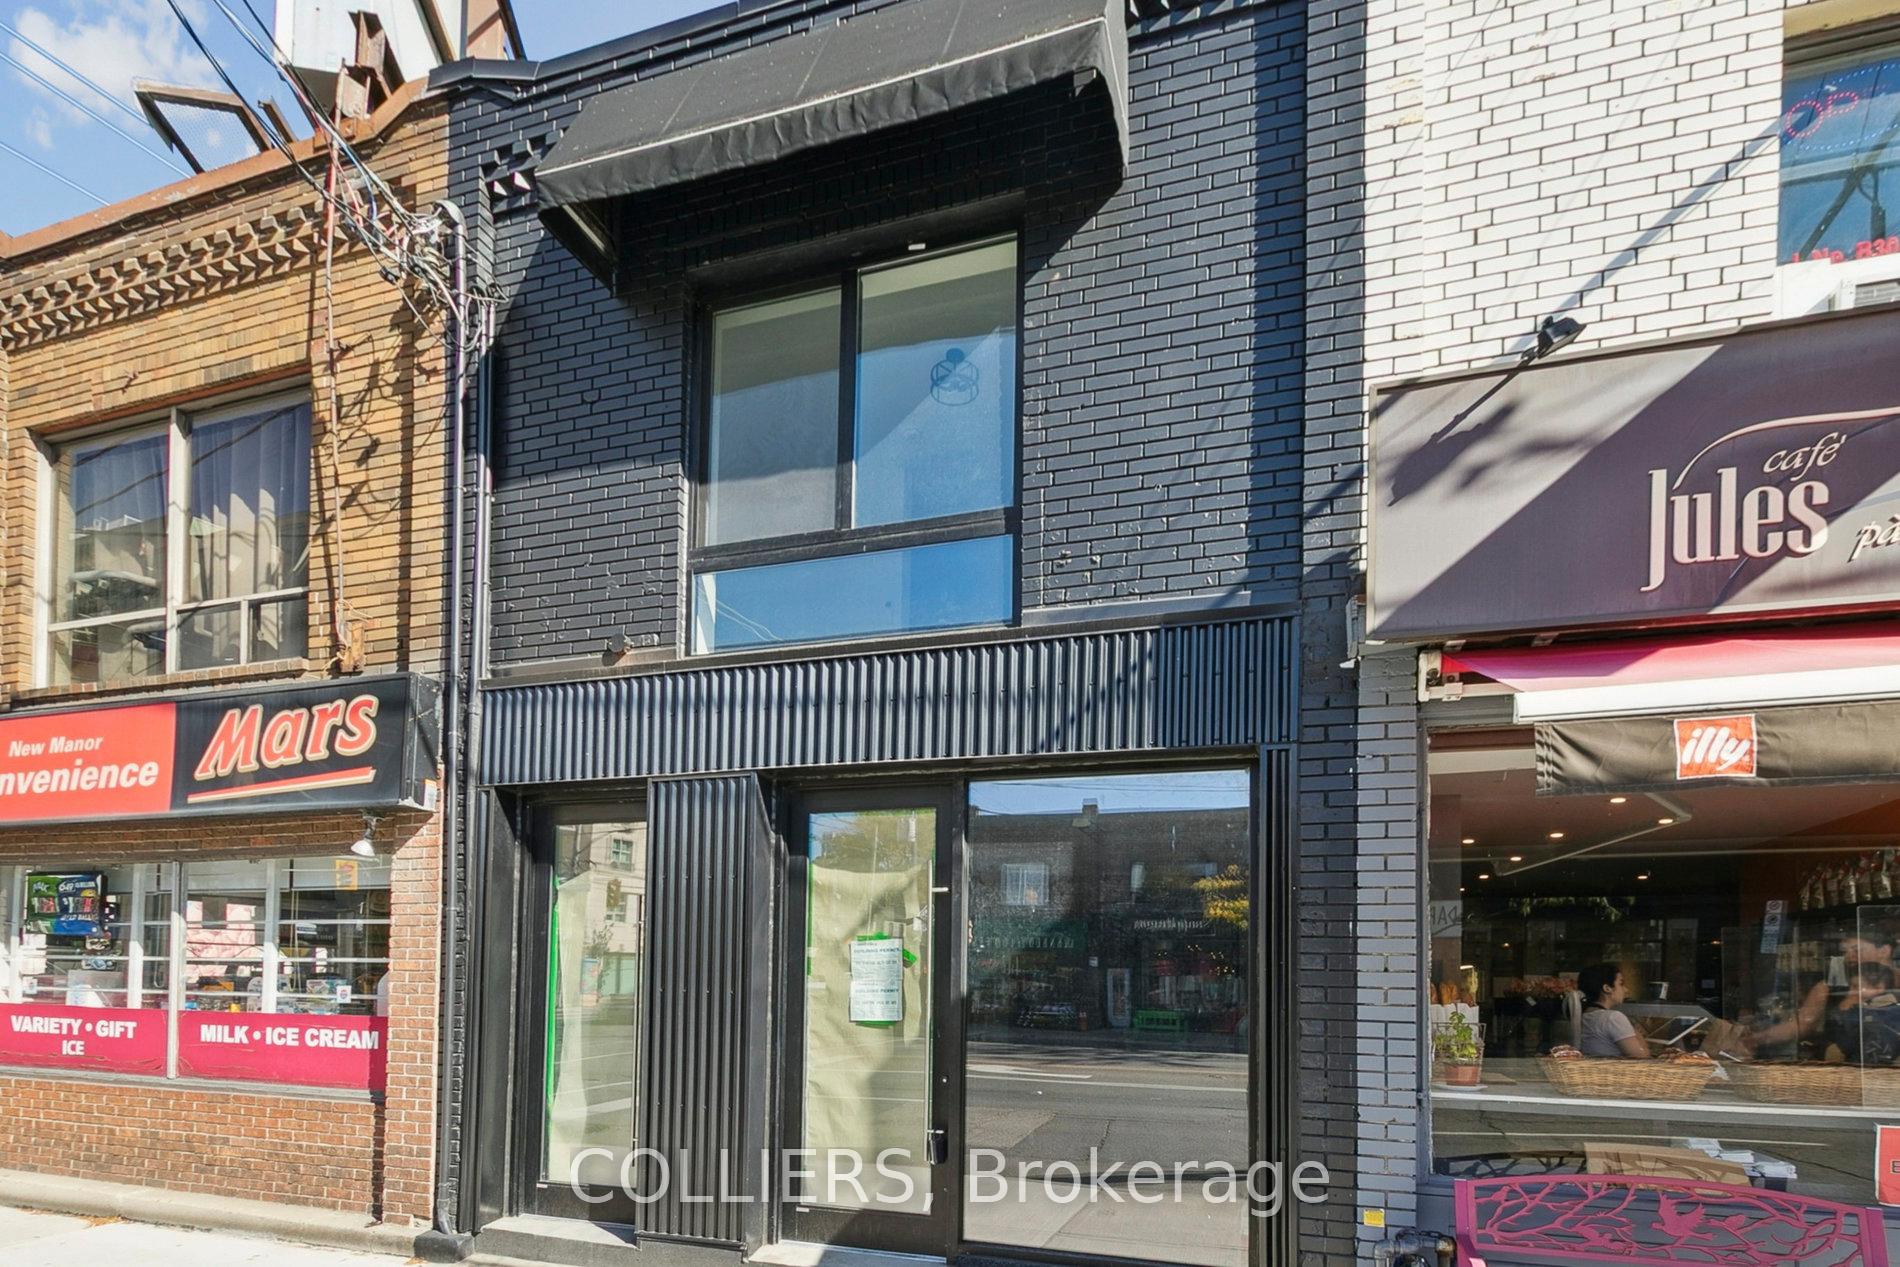
Listed by COLLIERS.
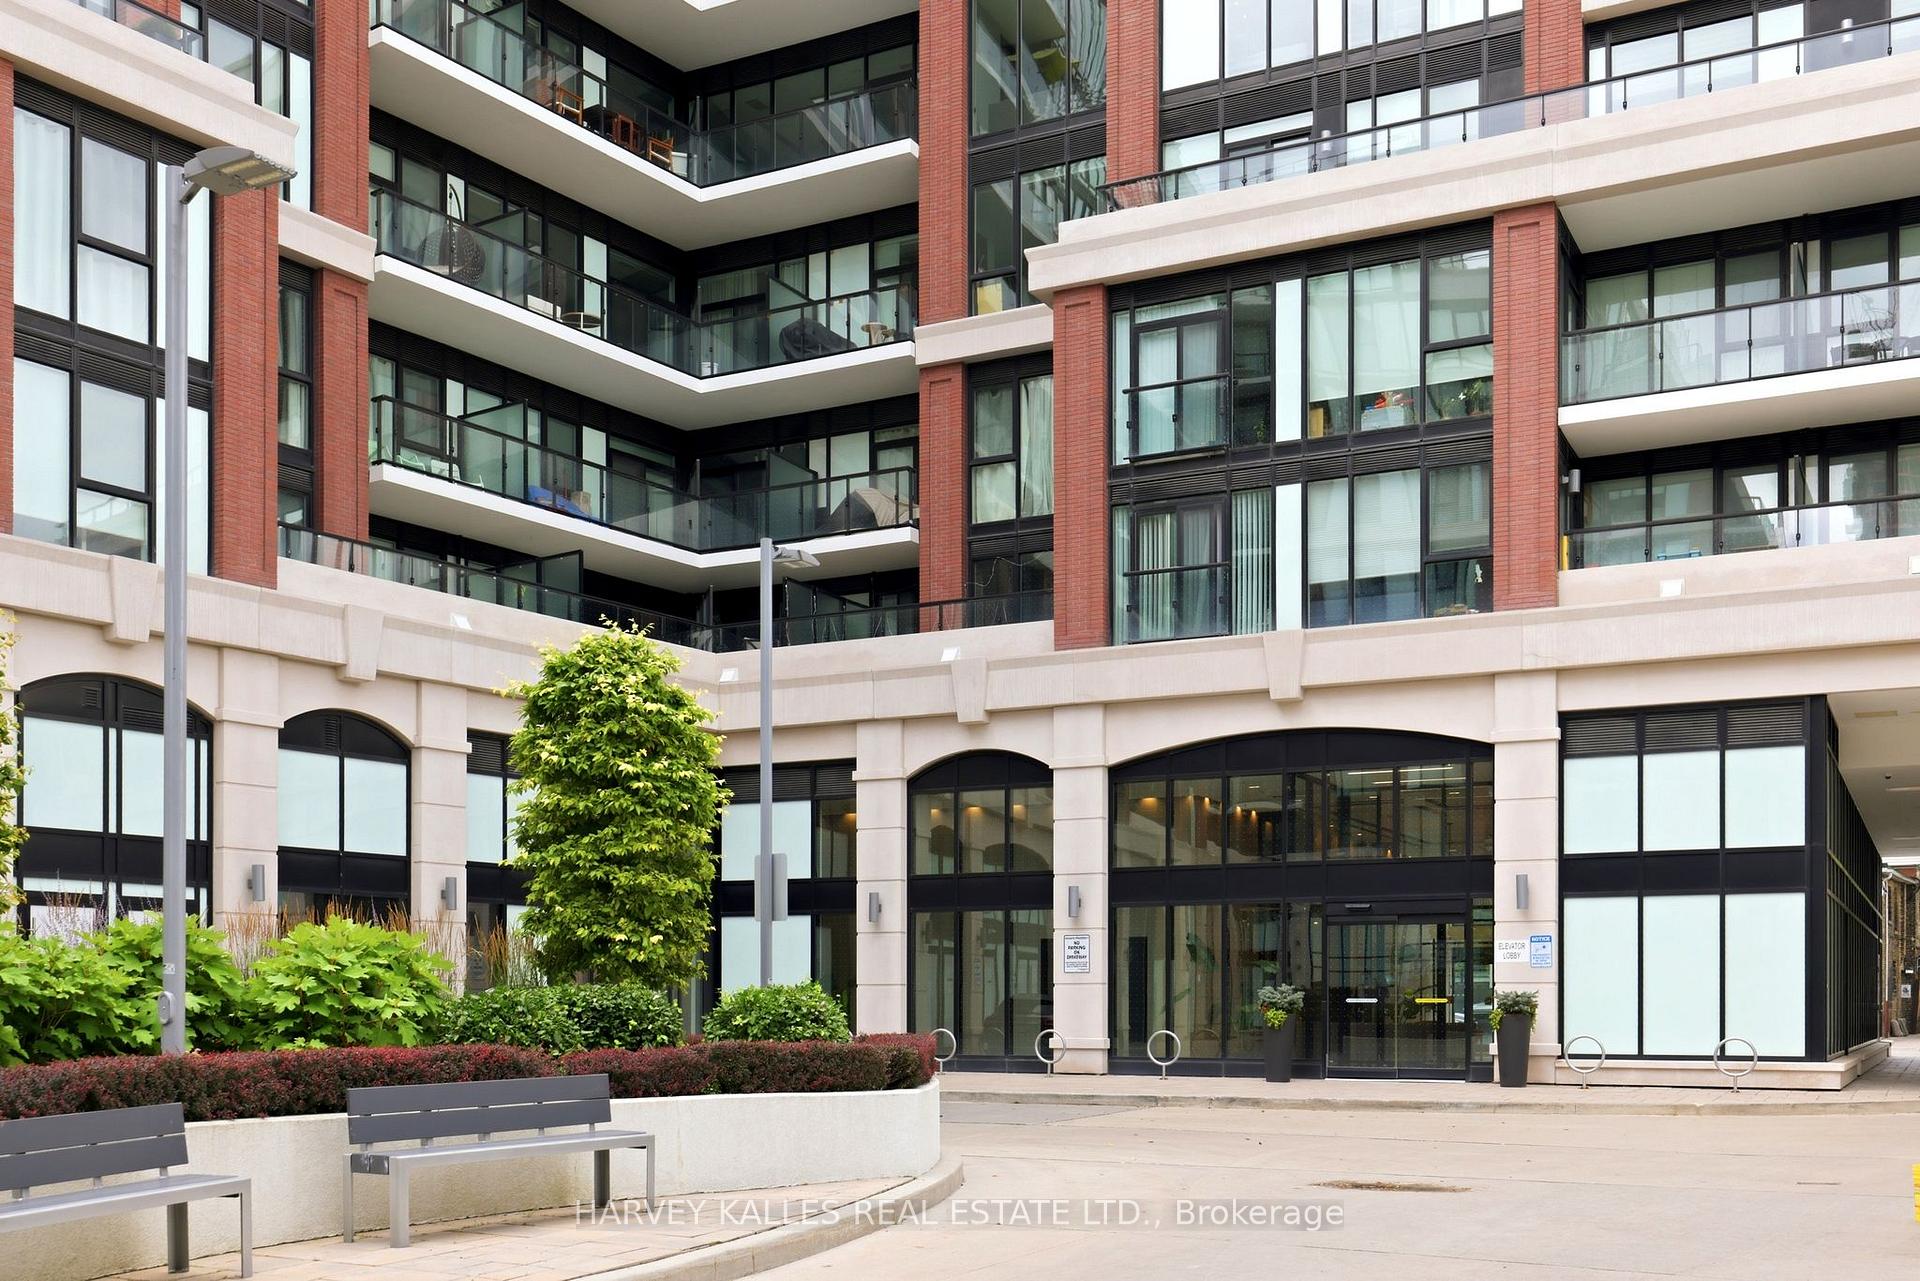
Listed by HARVEY KALLES REAL ESTATE LTD..
Listed by HARVEY KALLES REAL ESTATE LTD..
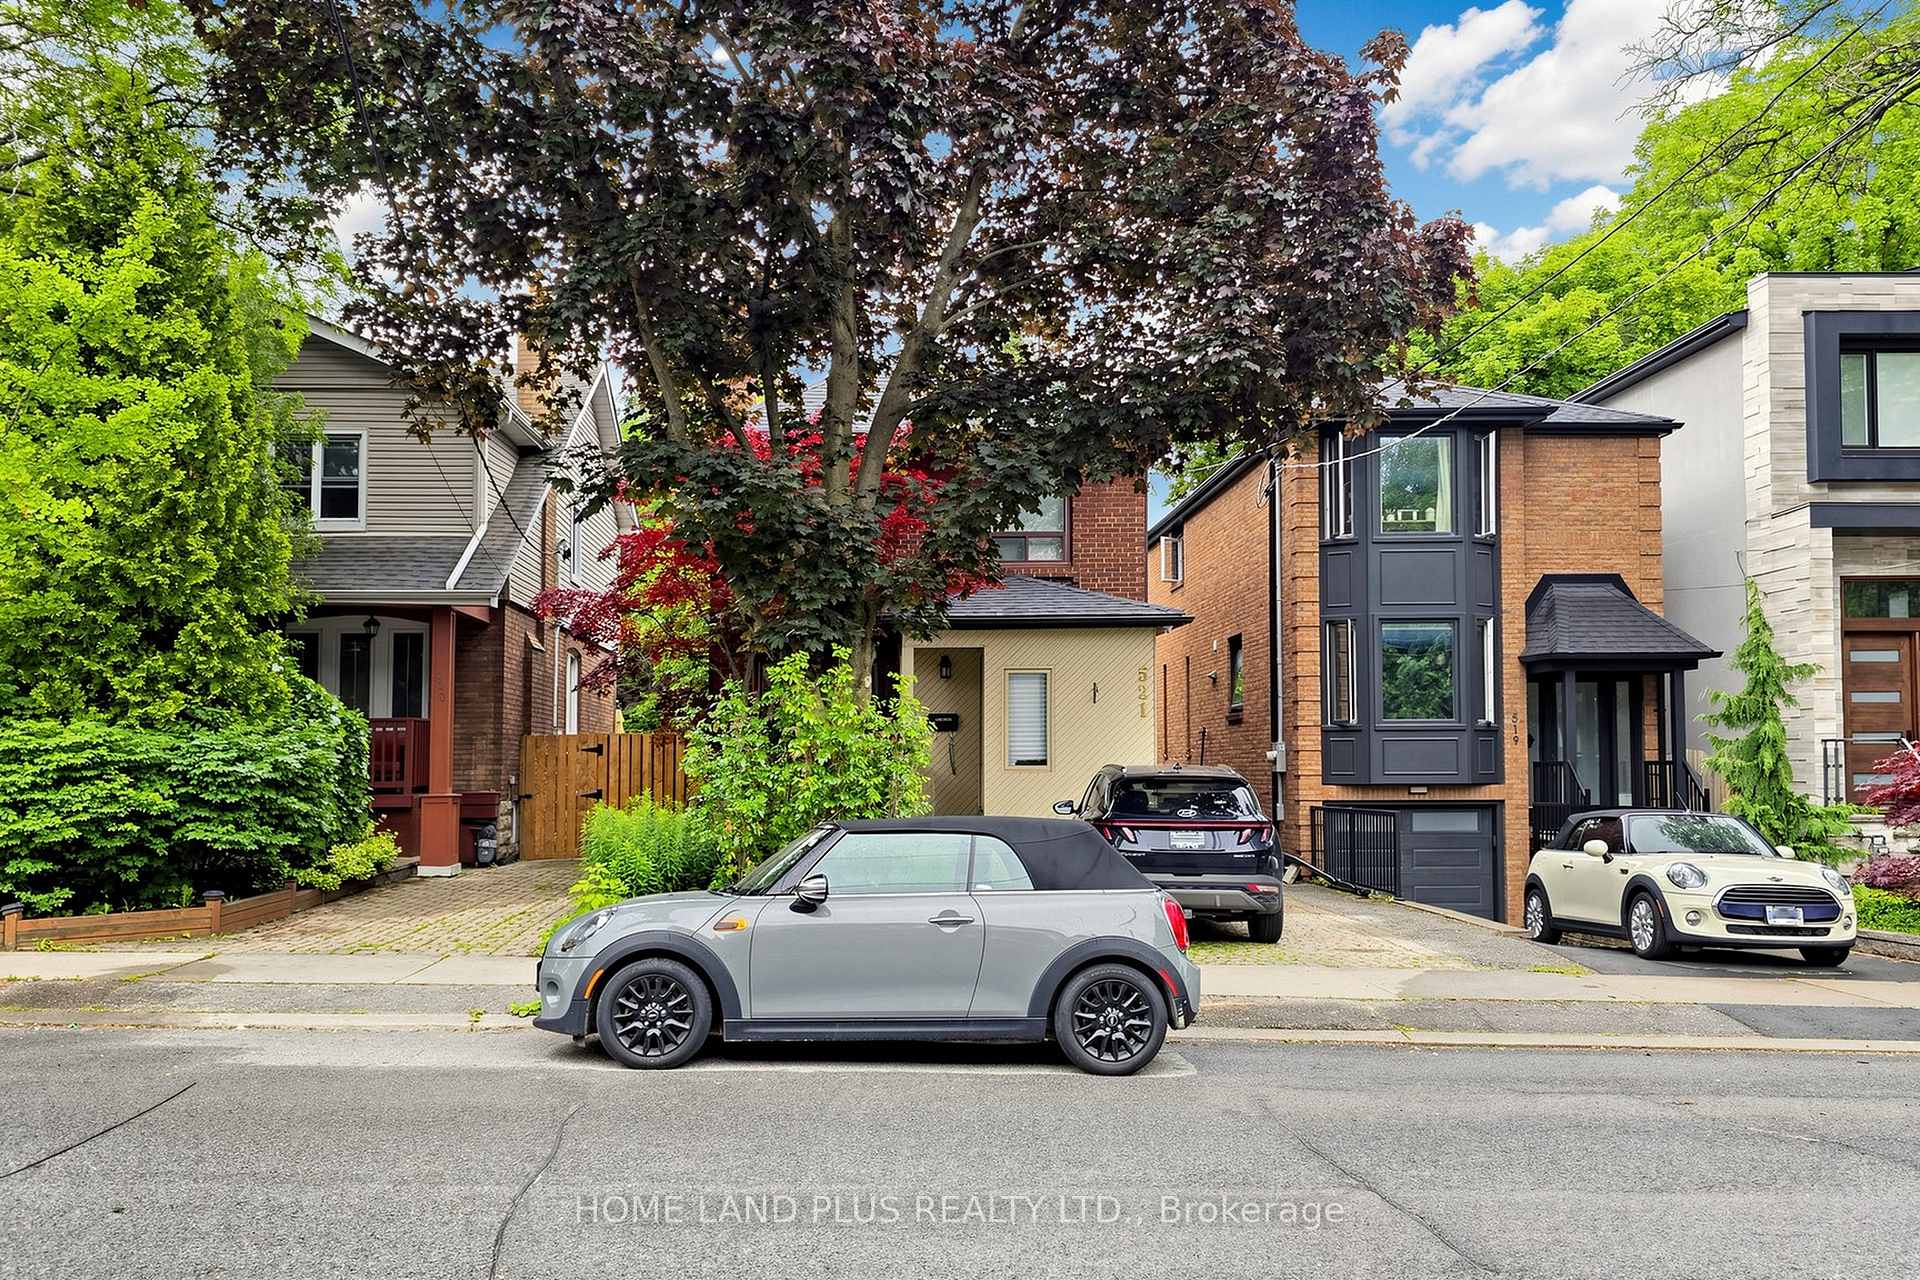
Listed by HOME LAND PLUS REALTY LTD..

Listed by CHESTNUT PARK REAL ESTATE LIMITED.
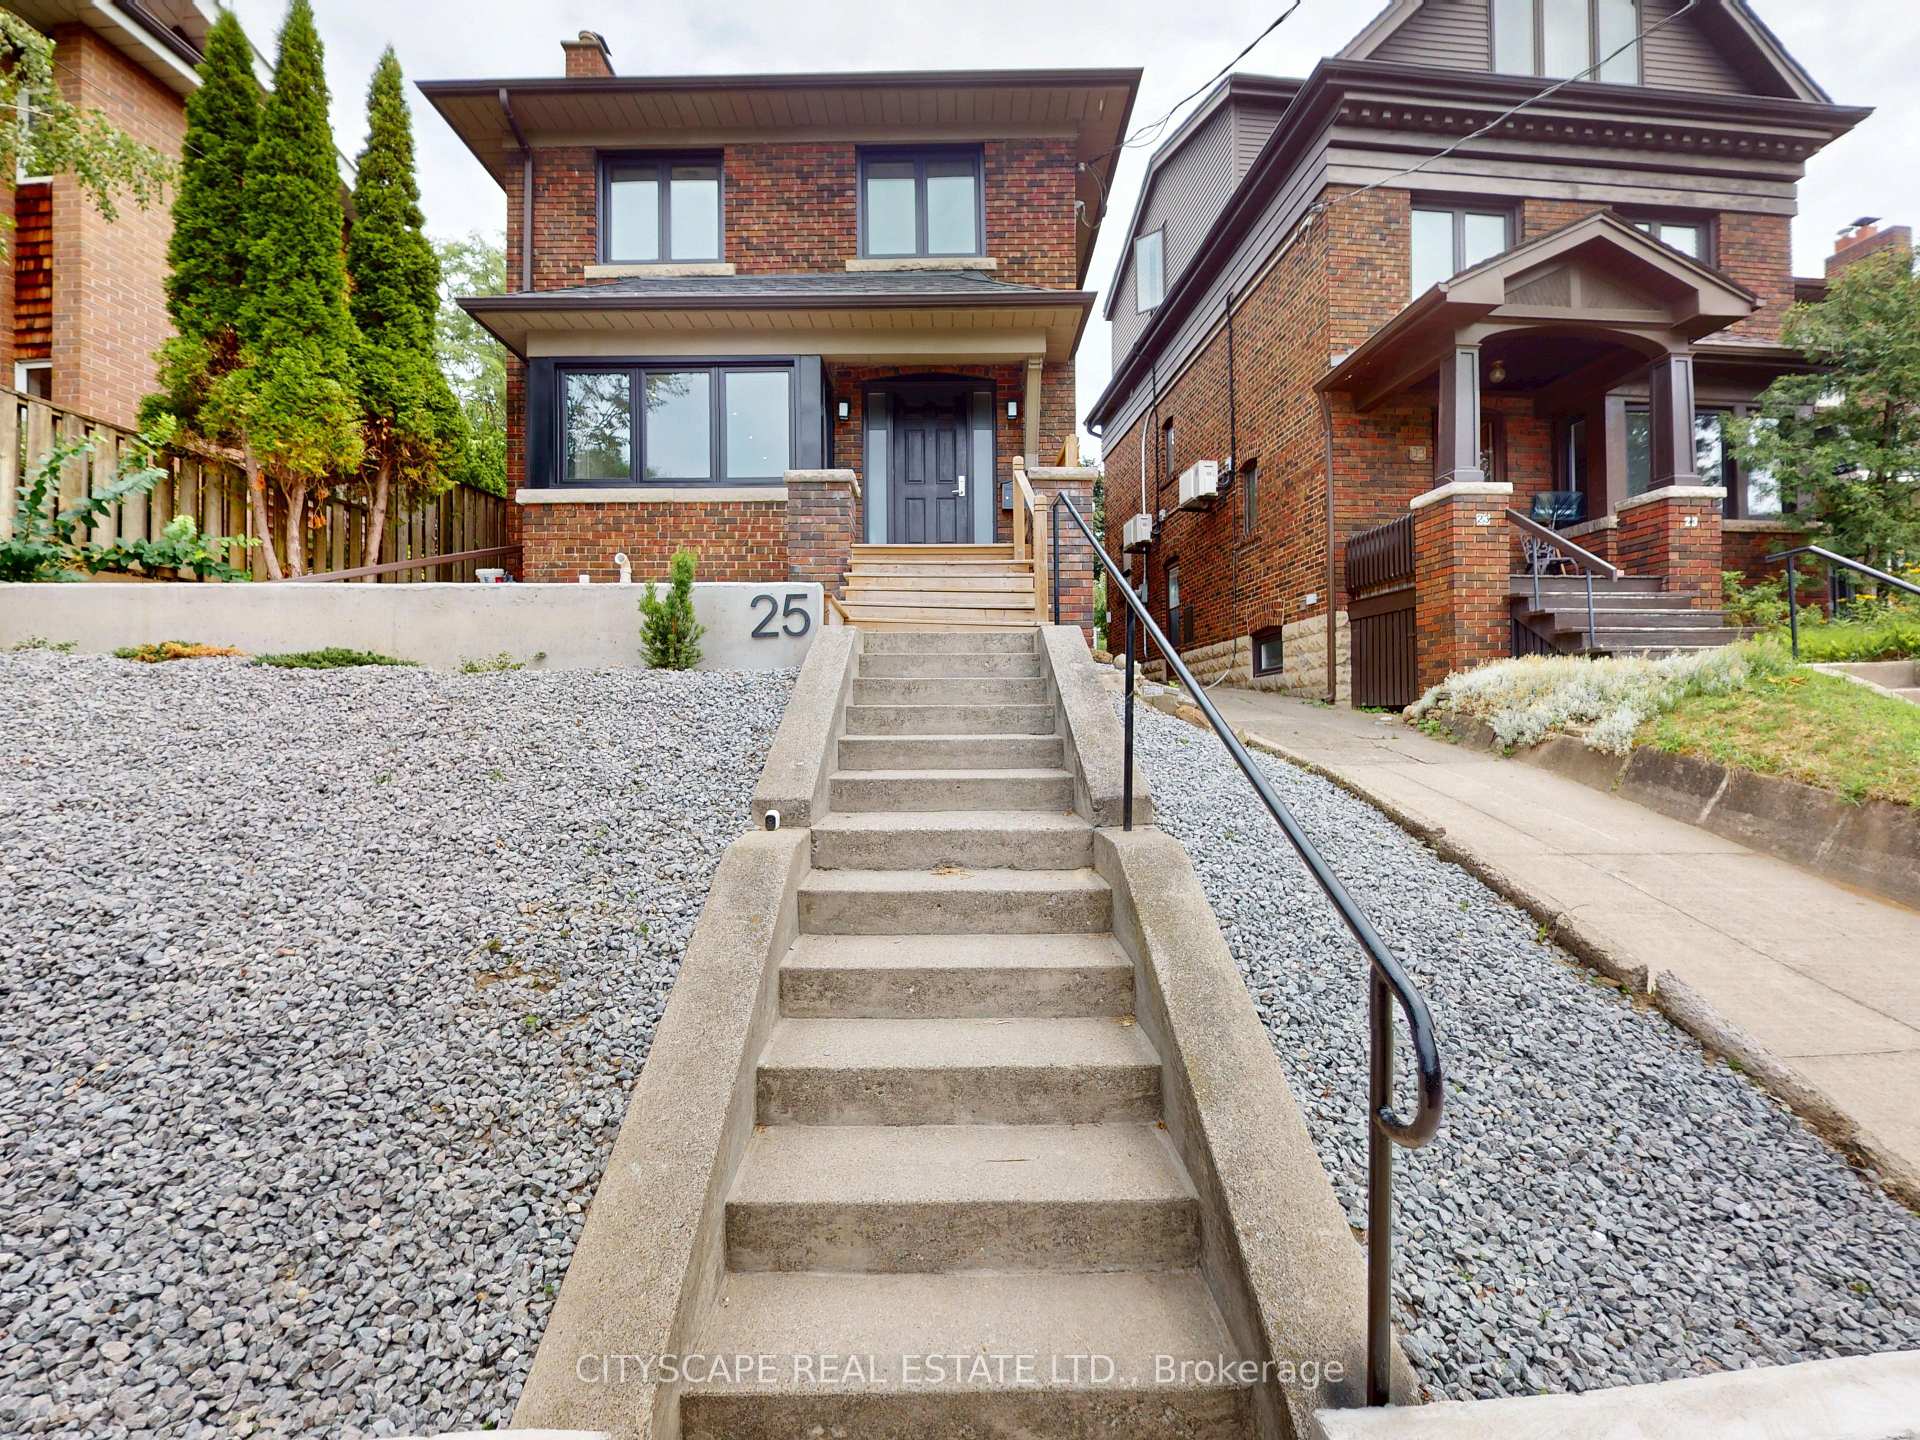
Listed by CITYSCAPE REAL ESTATE LTD..

Listed by CAPITAL NORTH REALTY CORPORATION.
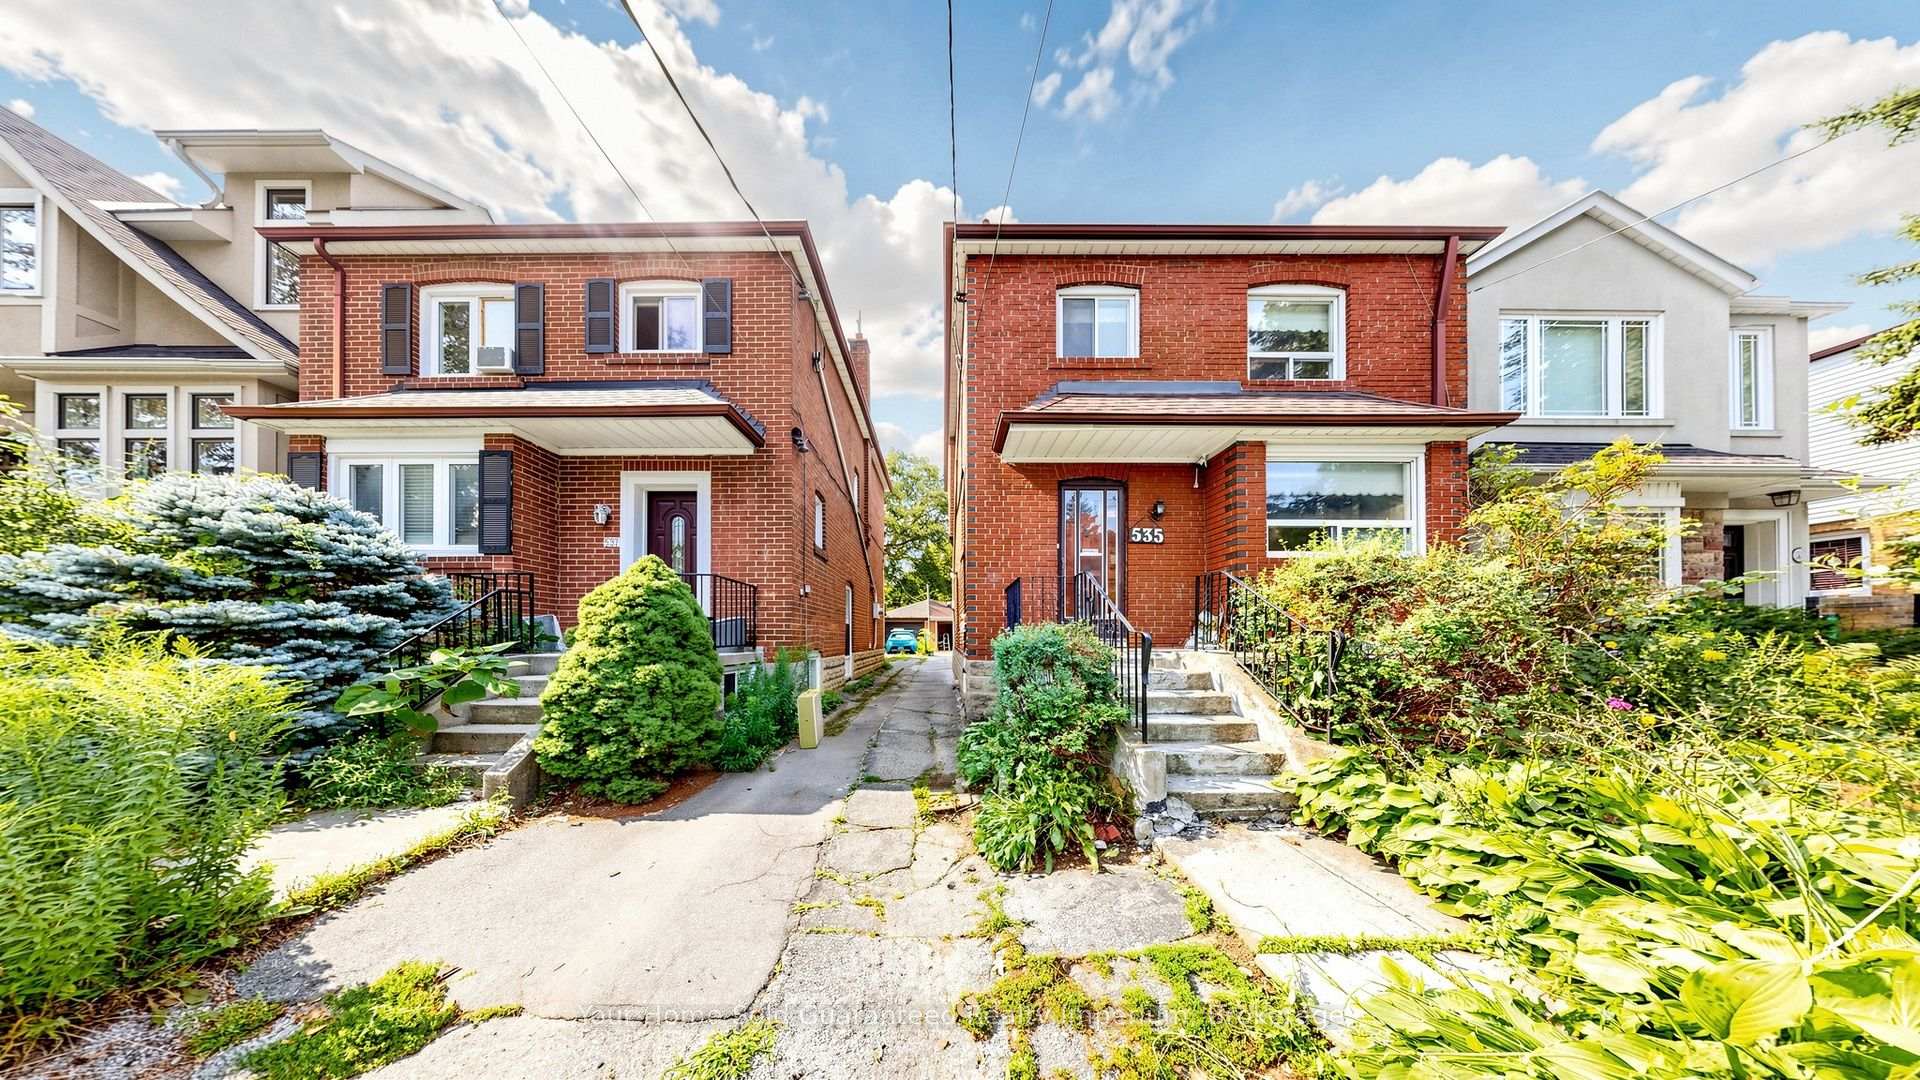
Listed by Your Home Sold Guaranteed Realty Imperium.

Listed by ROYAL LEPAGE TERREQUITY SEYMOUR REAL ESTATE.
Listed by SOTHEBY'S INTERNATIONAL REALTY CANADA.

Listed by REMAX YOUR COMMUNITY REALTY.

Listed by ROYAL LEPAGE REAL ESTATE SERVICES OXLEY REAL ESTATE.
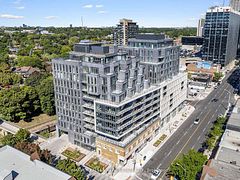
Listed by HARVEY KALLES REAL ESTATE LTD..
Listed by HARVEY KALLES REAL ESTATE LTD..
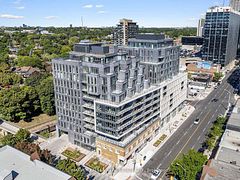
Listed by HARVEY KALLES REAL ESTATE LTD..

Listed by RE/MAX ALL-STARS REALTY INC..
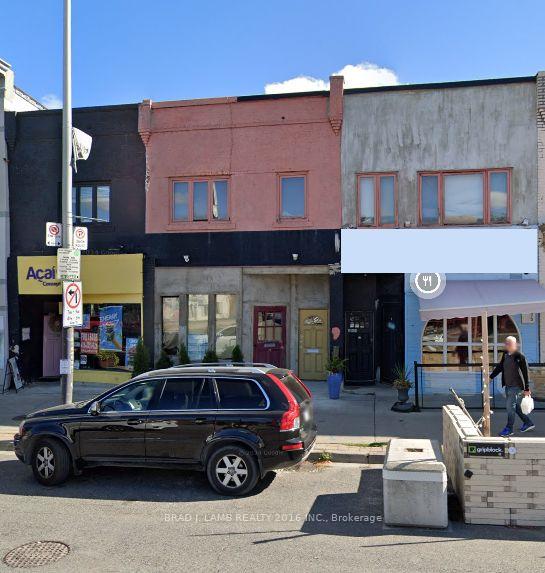
Listed by BRAD J. LAMB REALTY 2016 INC..
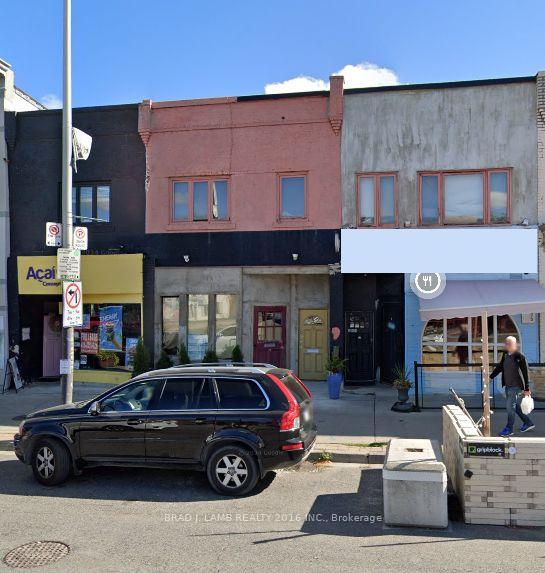
Listed by BRAD J. LAMB REALTY 2016 INC..
Listed by COLLIERS.
22.2% below the median per square foot of the 19 priced homes in this set
Listed by COLLIERS.
22.2% below the median per square foot of the 19 priced homes in this set
Listed by HARVEY KALLES REAL ESTATE LTD..
26.1% above the median per square foot of the 19 priced homes in this set
Listed by HARVEY KALLES REAL ESTATE LTD..
18.3% above the median per square foot of the 19 priced homes in this set
Listed by HOME LAND PLUS REALTY LTD..
31.2% below the median per square foot of the 19 priced homes in this set
Listed by CHESTNUT PARK REAL ESTATE LIMITED.
0.0% below the median per square foot of the 19 priced homes in this set
Listed by CITYSCAPE REAL ESTATE LTD..
5.5% below the median per square foot of the 19 priced homes in this set
Listed by CAPITAL NORTH REALTY CORPORATION.
3.0% above the median per square foot of the 19 priced homes in this set
Listed by Your Home Sold Guaranteed Realty Imperium.
26.8% below the median per square foot of the 19 priced homes in this set
Listed by ROYAL LEPAGE TERREQUITY SEYMOUR REAL ESTATE.
10.3% above the median per square foot of the 19 priced homes in this set
Listed by SOTHEBY'S INTERNATIONAL REALTY CANADA.
8.0% above the median per square foot of the 19 priced homes in this set
Listed by REMAX YOUR COMMUNITY REALTY.
1.3% above the median per square foot of the 19 priced homes in this set
Listed by ROYAL LEPAGE REAL ESTATE SERVICES OXLEY REAL ESTATE.
25.1% below the median per square foot of the 19 priced homes in this set
Listed by HARVEY KALLES REAL ESTATE LTD..
21.5% above the median per square foot of the 19 priced homes in this set
Listed by HARVEY KALLES REAL ESTATE LTD..
8.9% above the median per square foot of the 19 priced homes in this set
Listed by HARVEY KALLES REAL ESTATE LTD..
25.0% above the median per square foot of the 19 priced homes in this set
Listed by RE/MAX ALL-STARS REALTY INC..
9.3% below the median per square foot of the 19 priced homes in this set
Listed by BRAD J. LAMB REALTY 2016 INC..
15.9% below the median per square foot of the 19 priced homes in this set
Listed by BRAD J. LAMB REALTY 2016 INC..
19.6% below the median per square foot of the 19 priced homes in this set